Three Views on DAB Signal Quality: C/N – MER – BER
Bernhard Kistinger, DB9PP
You can also download this report here as English or German pdf file.
Why does QIRX measure so many parameters of the DAB signal? How can I interpret these figures? Isn't there a way to sum it all up into a single quality number?
The sound in digital transmission via DAB+ knows only two states: clear playback and silence. Unlike analogue FM, the transition is very abrupt. The audio stream can only be error-free or unusable.
This makes the evaluation of the reception quality particularly important. After all, you want to know how much reception reserve a channel has or what is the reason why another channel comes in so unstable. Is the signal too weak or maybe a preamplifier is overdriven?
Several parameters, which are obtained at different points in the signal path of the receiver, can help with this.
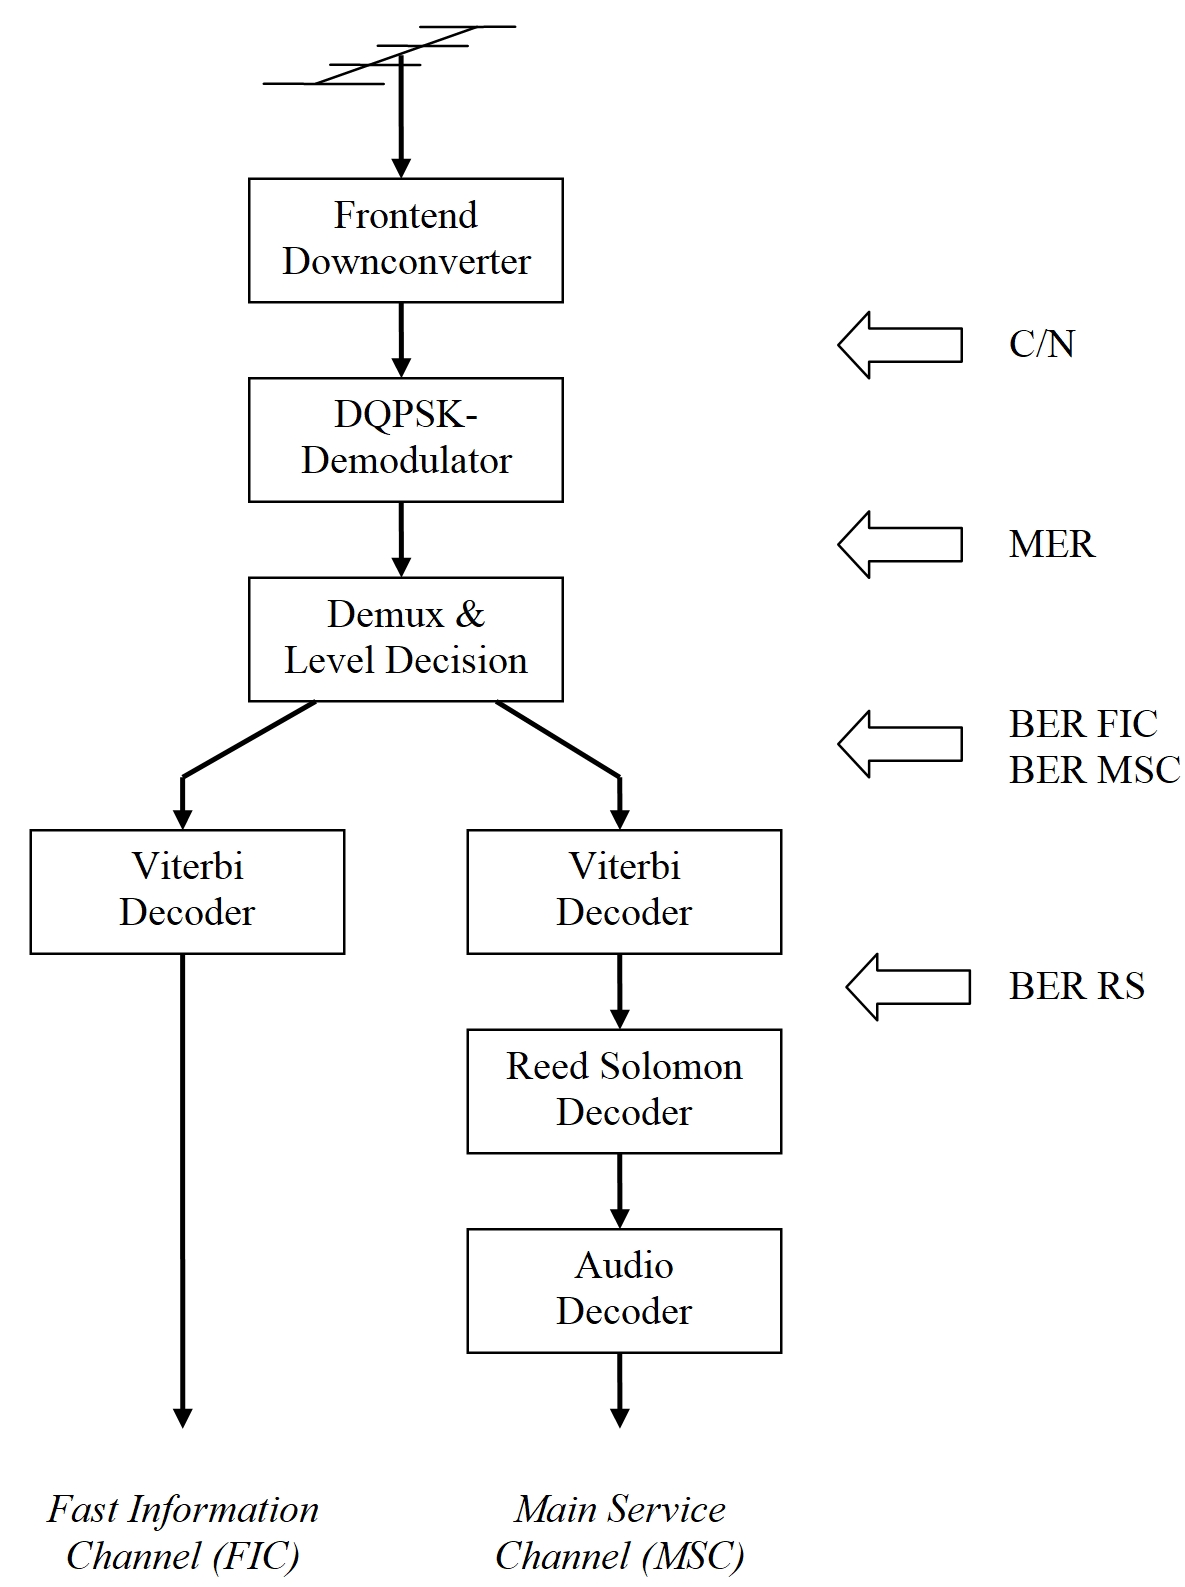
On the RF layer: C/N
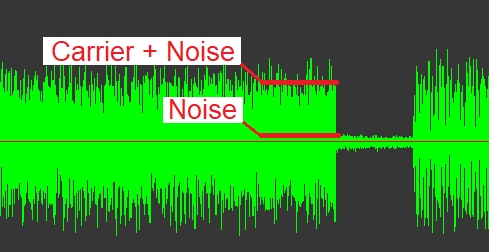
In the radio frequency range, after filtering to the bandwidth of 1.536 MHz, but before demodulation, the C/N (carrier-to-noise) is measured. It is defined as the ratio between the power received from the wanted signal and the superimposed noise and is usually displayed in dB.
 Determining
the level of the signal is easy. But how do you get the noise? You could
measure the signal strength at a frequency very close above or below the
channel. However, the method has the disadvantage that interference signals in
the channel that influence reception, e.g. intermodulation products or very
distant transmitters, are not detected.
Determining
the level of the signal is easy. But how do you get the noise? You could
measure the signal strength at a frequency very close above or below the
channel. However, the method has the disadvantage that interference signals in
the channel that influence reception, e.g. intermodulation products or very
distant transmitters, are not detected.
The null symbol on DAB+ provides a remedy: every 96 ms transmission pauses for 1.3 ms and only noise and other interference are received. Well, strictly speaking, you have to choose the right null symbol, because every second one still contains the transmitter ID (TII) and therefore does not pause completely.
After demodulation: MER
The
next stage in the receiver is the DQPSK demodulator. Each of the 1536
subcarriers of the DAB signal is calculated here in its position relative to
the previous symbol. Ideally, the amplitude remains constant and the phase has
one of the four expected angles of 45°, 135°, -45° and -135°. However, noise
and interference cause angles and amplitudes to fluctuate, which can be seen
well in the form of four "clouds" in the constellation diagram. The
diameter of these clouds is a measure for the quality of the demodulated
signal, the MER (Modulation Error Ratio). This definition can be found in the
technical report ETSI TR 101 290:
For each of the 1536 subcarriers, we have to collect many samples, get the center of the cloud from the samples’ mean value, calculate the distance to the respective center for each cloud point and then add everything up. Quite elaborate!
A simpler approach, which QIRX also uses, takes advantage of the deviations of the demodulated angles from their four ideal values. If you look at only one subcarrier over a not too long period of time, its associated cloud is quite round. We therefore can describe it by its radius R, which in turn corresponds approximately to the radian of the error angle w.
However, several effects influence the result:
- At very large angles w, the arc becomes longer than the direct line. However, other effects compensate for this error and so it reaches its maximum effect with -0.23 dB at a C/N of 12 dB
- For samples that are significantly closer to or further away from the coordinate origin than the center of the cloud, the radians deviate from the distance R
- Samples that are more than 45° off the correct angle are assigned to the wrong quadrant. For very low C/N the result is approaching a limit value of 3.87 dB and the MER is thus incorrectly reported too good
- If - e.g. due to reflections or reception of several SFN transmitters - the individual subcarriers have large level differences, the averaging of the angular errors will lead to worse values compared to the original formula. However, this calculation is permissible. It is equivalent to a measurement with a channel equalizer and, according to the Technical Report ETSI TR 101 290, even leads to more representative results!
The following diagram shows the relationship between C/N and MER when receiving a single transmitter that is only disturbed by noise.
The dotted line shows the theoretical relation. The MER at DAB is 3 dB worse than the C/N. Reason is that each cloud point represents the difference between two carriers, both of which are noisy. So the result scatters twice as much.
The previously described effects are noticeable below about 8 dB C/N. The curve is approaching the mentioned limit.
The DAB signal has high demands on the linearity of the transmission chain. Due to intermodulation, the MER lags behind the theoretical value at good C/N. For example, the MER of a DAB transmitter is about 34 dB, a synthetically generated test signal with 8-bit resolution reaches 33 dB.
What comes out at the end: BER
 The demodulator output provides an
angle and amplitude value per symbol for each of the 1536 subcarriers
corresponding to a point in the constellation diagram. According to their
location, the individual points are assigned to one of the four quadrants and
converted into data bits. As long as the MER is large (and the cloud is small),
it works error-free. As the signal deteriorates, more and more points are
incorrectly assigned, measured as BER (Bit Error Rate), evaluated separately
according to FIC (Fast Information Channel) and MSC (Main Service Channel).
The diagram shows the simulated relationship between C/N and BER when only
noise interferes the reception.
The demodulator output provides an
angle and amplitude value per symbol for each of the 1536 subcarriers
corresponding to a point in the constellation diagram. According to their
location, the individual points are assigned to one of the four quadrants and
converted into data bits. As long as the MER is large (and the cloud is small),
it works error-free. As the signal deteriorates, more and more points are
incorrectly assigned, measured as BER (Bit Error Rate), evaluated separately
according to FIC (Fast Information Channel) and MSC (Main Service Channel).
The diagram shows the simulated relationship between C/N and BER when only
noise interferes the reception.
There's just one problem: we don't know the correct data, so how can the bad bits be detected and counted? Because data transmission is never completely error-free, DAB+ uses two methods for error correction: convolutional codes and Reed Solomon codes. To put it simply, more bits are sent than are necessary for audio transmission. From the redundancy of the data, errors can be detected and corrected up to a certain percentage. This happens first in the Viterbi decoder and after that in the RS decoder. So corrected data is provided on the basis of which the error rates can be determined.
If the reception becomes so bad that not all errors can be corrected, this of course also affects the calculated BER. This is why this measuring principle is correctly referred to as the „pseudo-BER“.
The real main task of error correction is, of course, error-free audio reproduction!
What numbers can tell us: Interpretations
Back to the initial question: Why so many numbers when all parameters depend on each other?
The theoretical relationship between C/N, MER and BER only applies to clean reception, which is superimposed exclusively by "white" noise – no reflections, sine carriers, SFN transmitters, intermodulations... In practice, however, the situation is different.
Some examples of what can be read from the QIRX displays:
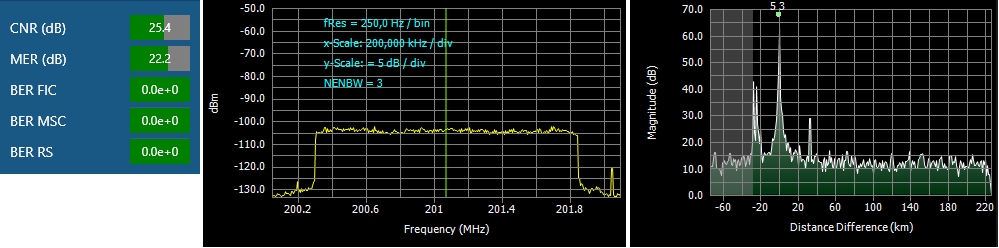
Nearly perfekt: one dominant transmitter without reflections, sufficient level, C/N and MER differ by 3 dB.
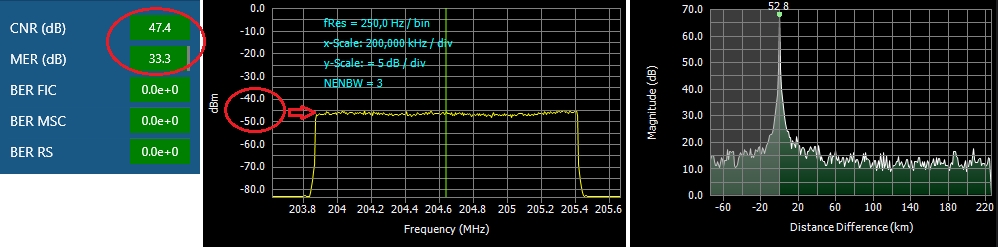
A local transmitter: 60 dB more level than in the first example causes over 47 dB C/N, the MER still only reaches 33dB. Transmitter and receiver linearity are not better...
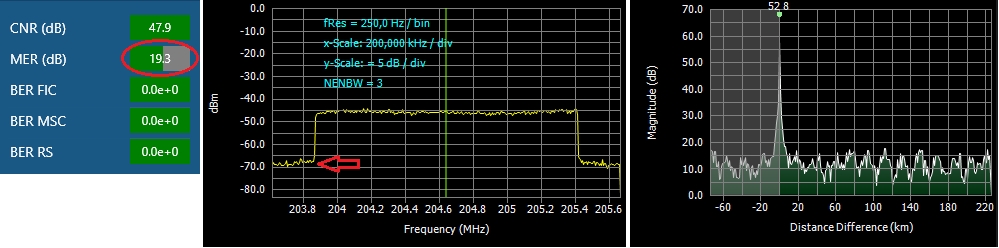
Overdriven: The same signal, but with a little too much of gain. The MER drops significantly, and in the spectrum, the noise next to the channel increases signifcantly. An overdriven preamplifier has a similar effect. If possible, test with less pre-amplification or antenna level!
A sinusoidal signal in the channel: The C/N is 9 dB lower than the MER, since the sine wave is also present during the null symbol. It interferes with only two of the 1536 lines of the DAB spectrum (0.13%), all others are demodulated without errors. Accordingly, the BER rises only slightly, the MER is unimpressed by the disturber.
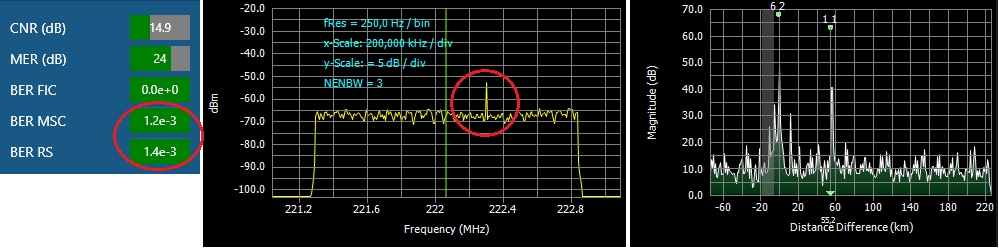
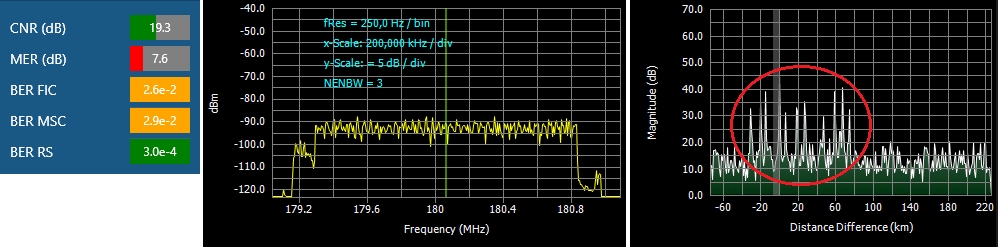
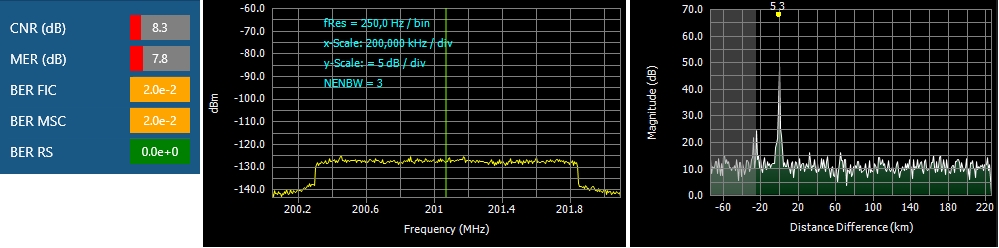
It's going to be tight: At BER, it can be seen that there is not much reserve left. At 10% at the latest, the reception finally will break, but the Viterbi and RS algorithms still manage to decode the data without errors. The MER is actually at 5... 6 dB, this is where the display becomes inaccurate. Is the signal really that weak? Then only more antenna or lower noise pre-amplification helps. However, the noise could also be caused by mixed products of other DAB channels or strong signals on the neighboring channels.
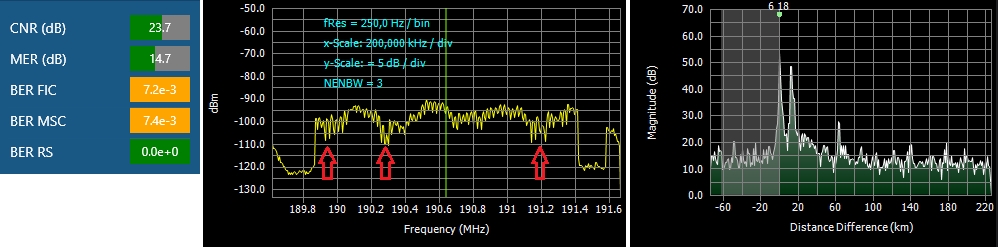
Two transmitters: The superposition causes minima in the spectrum, where the MER becomes very bad. The displayed average value is significantly smaller than would be expected according to the C/N. But it is logical, since the calculation is based on the average value of good and bad areas. Error correction has no problems with this.
Finally, an entire network of transmitters: 11 transmitters can be seen in the CIR, which are spread over 110 km. The signal is sufficiently strong, and there are no dips in the spectrum. The reason for the scarce MER is SFN interference that violates the guard interval. Transmitters that are more than 75 km (corresponding to 250 μs) apart in the CIR interfere with each other.
This is where the DAB system reaches its limits.