QIRX SDR
Digital Audio Broadcast : TII Collisions
Part II: Detection and Resolution
A Tutorial by Clem, DF9GI
In a DAB Single Frequency Network (SFN) "TII Collisions" might be generated by two or more contributing transmitters having
the same Sub Id but different Main Ids.
In part I of this tutorial, we have seen what the Null Symbol is and how TII Codes are decoded from the Null Symbol.
We also learnt why colliding TII Codes cannot be unambiguously resolved.
In this second part we will see how we are able to identify TII Collisions in QIRX, and how to apply
the available methods to resolve them.
Remark: In case you are less interested in the details presented here (what I would regret),
but more in a concise instruction list which
steps are ncessary to resolve a TII collision, please continue directly here
in the summary.
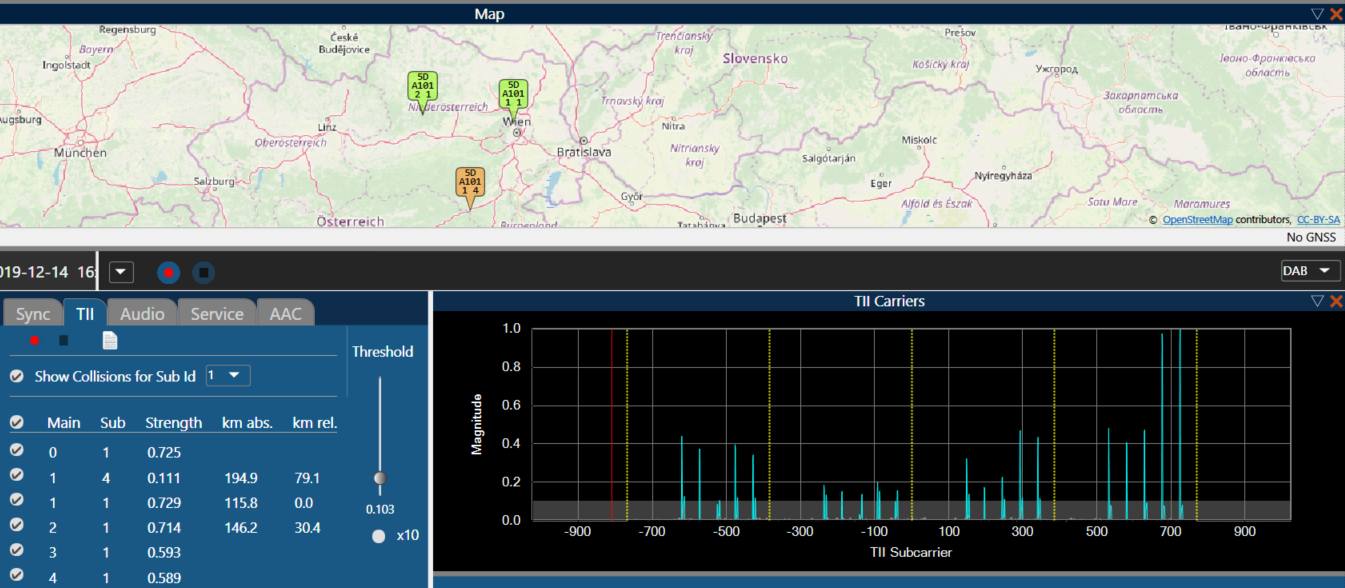
A Suspicious Spectrum
Please have a look at the following picture, showing the TII spectrum of the Ensemble "DAB Austria". The decoder detected a mux with
a MainId/SubId of 1/4. The corresponding carriers are painted in blue color in the spectrum.
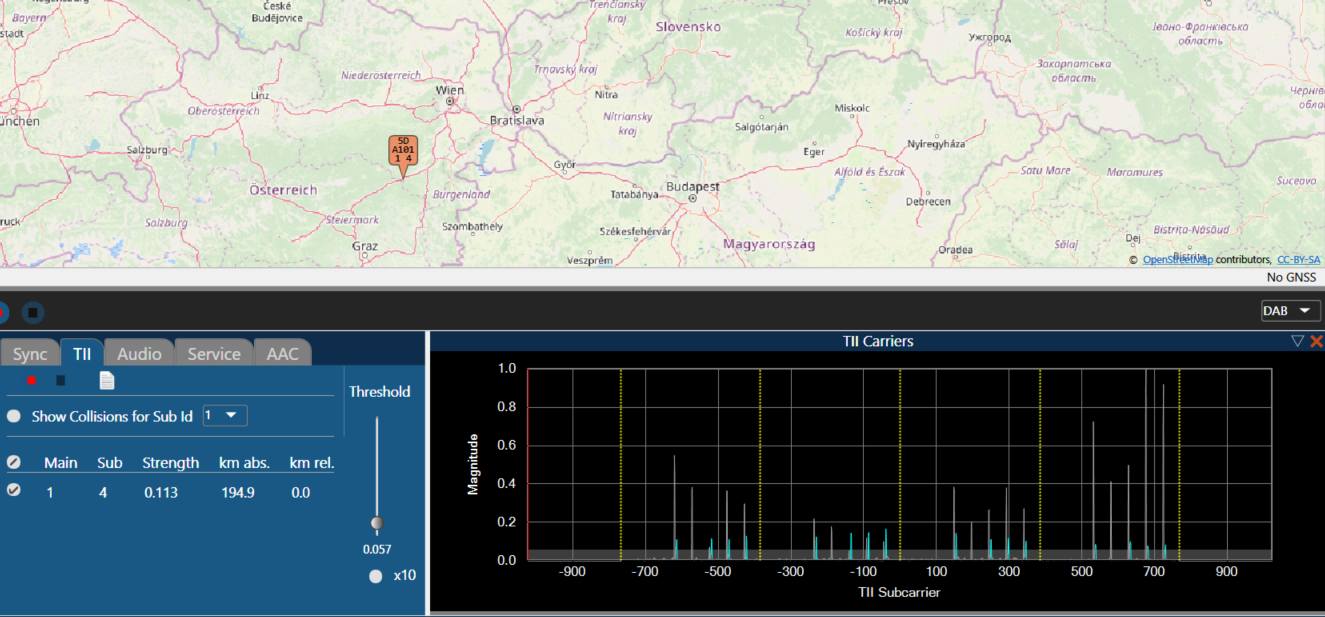
However, this spectrum looks suspicious in several ways:
-
Should "DAB Austria" really not transmit also from Vienna? Seems to be very strange.
-
The (colored) carriers belonging to the single detected mux are not the strongest ones.
-
The strongest carriers are all grey, indicating that their TII Code could not be resolved.
-
In each of the four "compartments" (see Part I) five grey unresolved carriers are present.
This "smells" of a TII Collision.
Identifying the Collision
How can we find out whether we have here a TII Collision? If you remember Part I of this tutorial, such a case happens if there are at least two
transmitters having in their TII Code different Main Ids, sharing the same Sub Id. From a technical point of view this is the case when not
exactly four carrier-pairs are present in one compartment of eight blocks, but five or more having identical Sub Ids.
We can easily find out if this is the case in the
above spectrum by zooming into it
and check the Sub Ids of the carriers by hovering with the mouse over them and inspecting the tooltip.
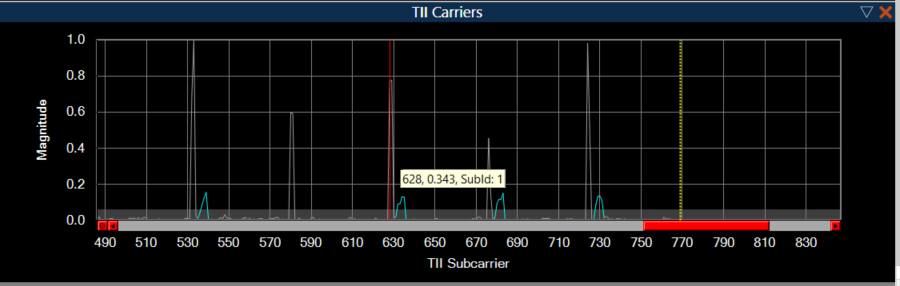
The information in the tooltip shows a Sub Id of 1, belonging to the strong grayed carrier to the left of the yellow box. Repeating this for the
other unresolved carriers, we find out that all five show a Sub Id of 1, confirming the TII Collision. But what to do with this information?
Resolving the Collision?
QIRX definitely is not able to resolve the collision by itself. It might be able to help you though. In a first step, you
could activate the checkbox "Show Collisions for Sub Id 1", after having selected a "1" in the corresponding combo box.
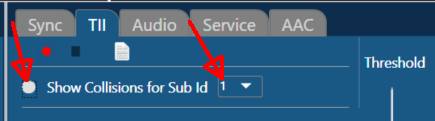
You might remember that we found out in Part I of this tutorial that - having five instead of the four required carriers for an unambiguous identification -
we expect a maximum of five transmitters forming our five possible carriers of the collision. QIRX will be happy to show these if you bother to
activate the checkbox shown in the last picture. Here is the result:
The list shows all five TII Codes with a Sub Id of 1, as expected. The carriers area all painted in blue, meaning that our assumption was right
that they all contribute to the colliding TII Codes. If you want, you can select only one checkbox in the TII List and see which
carrier combination contributes to that TII Code. The next picture shows the carrier combination of the TII Code 2/1, as an example:
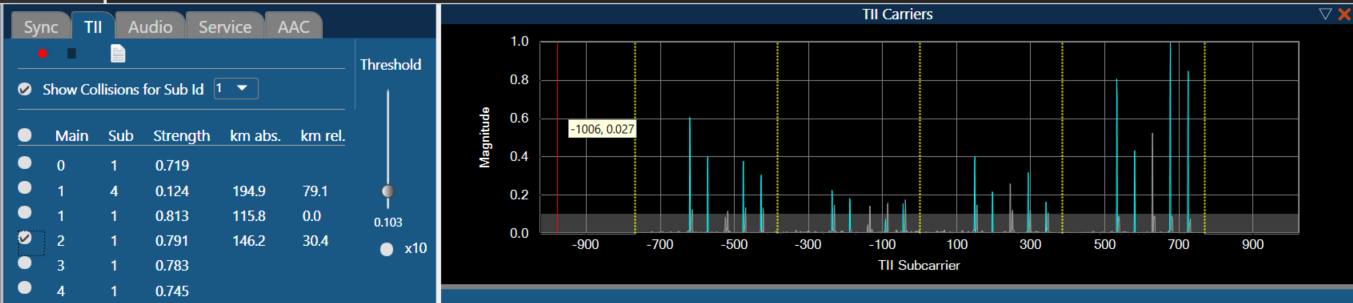
One carrier within the groups of five carriers with Sub Id of "1" is grayed, it is the one not necessary for Code 2/1.
Caveat
The important point with this whole procedure is that it might be tempting to accept the result shown in the TII list and the map and assume
that for every TII Code a corresponding transmitter is located somewhere being actually received. Neither it is necessary that a transmitter with
a colliding TII Code exists nor that one is actually received.
Please DO NOT fall into this trap, as it would be fundamentally wrong,
regardless whether a transmitter for an offending TII code is already present in the database (thus showing up on the map as a consequence) or not.
In most cases this will not be true. What is definitely true is that there are at least two received transmitters somewhere out there,
both having a TII code with Sub Id of 1 and different Main Ids. It might be
three, four or five, but this information cannot be obtained from the list. So unfortunately the question remains:
How Can the Puzzle be Solved?
This is the problem of you, the user. But don't despair, there are some strong facts you might wish to exploit.
-
Map Information
Have a look at the map above. Some kind person already had entered two transmitters
with the TII Codes of 1/1 and 2/1 into the database. However, from the fact that a colliding transmitter
is present in the database it must NOT be concluded that this station is also one of the really received ones.
But here in our situation we have a good chance that - from the depicted location - both are in fact actually received.
Cross-checks will be necessary though.
The third shown
transmitter does not interest us here, as it has a TII Code of 1/4 (i.e. Sub Id 4). It is detected
quite normally and does not contribute to the collision.
-
Channel Impulse Response (CIR)
Remember the "Channel Impulse Response"? This diagram can be shown in QIRX and shows for every transmitter contributing
to the received signal a peak in its spectrum. In our case it looks like so:
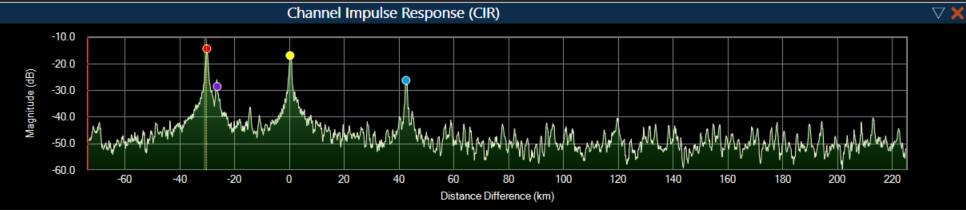
From this diagram we identify four peaks, each belonging either to a real transmitter or to some kind of reflection e.g. at a
mountain or other obstacles deviating the path of the electromagnetic wave on its way to the receiver. As our above map only
shows three transmitters and not four, we might perhaps expect such a "multipath" situation. However this assumption turned out
to be wrong, as a fourth transmitter shows up in the map when we reduce the TII threshold somewhat. See below.
The CIR scale shows "Distance Differences" meaning differences of distances between the receiver and the corresponding transmitters.
The value of "0" usually indicates the peak for the strongest transmitter, but not always, as can be seen in the diagram.
The relative distances of the CIR might be compared to those of the TII list, where also one with a km rel. value of "0.0" is shown.
Usually this corresponds to the "0" peak in the CIR, but not always. In our example here, it does not, as we'll see in a second.
In a DAB Single Frequency Network (SFN) "TII Collisions" might be generated by two or more contributing transmitters having
the same Sub Id but different Main Ids.
In part I of this tutorial, we have seen what the Null Symbol is and how TII Codes are decoded from the Null Symbol.
We also learnt why colliding TII Codes cannot be unambiguously resolved.
In this second part we will see how we are able to identify TII Collisions in QIRX, and how to apply
the available methods to resolve them.
Remark: In case you are less interested in the details presented here (what I would regret),
but more in a concise instruction list which
steps are ncessary to resolve a TII collision, please continue directly here
in the summary.
A Suspicious Spectrum
Please have a look at the following picture, showing the TII spectrum of the Ensemble "DAB Austria". The decoder detected a mux with
a MainId/SubId of 1/4. The corresponding carriers are painted in blue color in the spectrum.
However, this spectrum looks suspicious in several ways:
- Should "DAB Austria" really not transmit also from Vienna? Seems to be very strange.
- The (colored) carriers belonging to the single detected mux are not the strongest ones.
- The strongest carriers are all grey, indicating that their TII Code could not be resolved.
- In each of the four "compartments" (see Part I) five grey unresolved carriers are present.
Identifying the Collision
How can we find out whether we have here a TII Collision? If you remember Part I of this tutorial, such a case happens if there are at least two
transmitters having in their TII Code different Main Ids, sharing the same Sub Id. From a technical point of view this is the case when not
exactly four carrier-pairs are present in one compartment of eight blocks, but five or more having identical Sub Ids.
We can easily find out if this is the case in the
above spectrum by zooming into it
and check the Sub Ids of the carriers by hovering with the mouse over them and inspecting the tooltip.
The information in the tooltip shows a Sub Id of 1, belonging to the strong grayed carrier to the left of the yellow box. Repeating this for the
other unresolved carriers, we find out that all five show a Sub Id of 1, confirming the TII Collision. But what to do with this information?
Resolving the Collision?
QIRX definitely is not able to resolve the collision by itself. It might be able to help you though. In a first step, you
could activate the checkbox "Show Collisions for Sub Id 1", after having selected a "1" in the corresponding combo box.
You might remember that we found out in Part I of this tutorial that - having five instead of the four required carriers for an unambiguous identification -
we expect a maximum of five transmitters forming our five possible carriers of the collision. QIRX will be happy to show these if you bother to
activate the checkbox shown in the last picture. Here is the result:
The list shows all five TII Codes with a Sub Id of 1, as expected. The carriers area all painted in blue, meaning that our assumption was right
that they all contribute to the colliding TII Codes. If you want, you can select only one checkbox in the TII List and see which
carrier combination contributes to that TII Code. The next picture shows the carrier combination of the TII Code 2/1, as an example:
One carrier within the groups of five carriers with Sub Id of "1" is grayed, it is the one not necessary for Code 2/1.
Caveat
The important point with this whole procedure is that it might be tempting to accept the result shown in the TII list and the map and assume
that for every TII Code a corresponding transmitter is located somewhere being actually received. Neither it is necessary that a transmitter with
a colliding TII Code exists nor that one is actually received.
Please DO NOT fall into this trap, as it would be fundamentally wrong,
regardless whether a transmitter for an offending TII code is already present in the database (thus showing up on the map as a consequence) or not.
In most cases this will not be true. What is definitely true is that there are at least two received transmitters somewhere out there,
both having a TII code with Sub Id of 1 and different Main Ids. It might be
three, four or five, but this information cannot be obtained from the list. So unfortunately the question remains:
How Can the Puzzle be Solved?
This is the problem of you, the user. But don't despair, there are some strong facts you might wish to exploit.
-
Map Information
Have a look at the map above. Some kind person already had entered two transmitters with the TII Codes of 1/1 and 2/1 into the database. However, from the fact that a colliding transmitter is present in the database it must NOT be concluded that this station is also one of the really received ones. But here in our situation we have a good chance that - from the depicted location - both are in fact actually received. Cross-checks will be necessary though.
The third shown transmitter does not interest us here, as it has a TII Code of 1/4 (i.e. Sub Id 4). It is detected quite normally and does not contribute to the collision. -
Channel Impulse Response (CIR)
Remember the "Channel Impulse Response"? This diagram can be shown in QIRX and shows for every transmitter contributing to the received signal a peak in its spectrum. In our case it looks like so:
From this diagram we identify four peaks, each belonging either to a real transmitter or to some kind of reflection e.g. at a mountain or other obstacles deviating the path of the electromagnetic wave on its way to the receiver. As our above map only shows three transmitters and not four, we might perhaps expect such a "multipath" situation. However this assumption turned out to be wrong, as a fourth transmitter shows up in the map when we reduce the TII threshold somewhat. See below.
The CIR scale shows "Distance Differences" meaning differences of distances between the receiver and the corresponding transmitters. The value of "0" usually indicates the peak for the strongest transmitter, but not always, as can be seen in the diagram.
The relative distances of the CIR might be compared to those of the TII list, where also one with a km rel. value of "0.0" is shown. Usually this corresponds to the "0" peak in the CIR, but not always. In our example here, it does not, as we'll see in a second.
The Whole Picture
Now, as we have filled our toolbox with TII List, TII Carrier spectrum, CIR Spectrum and the Map, we should have a good chance to finally solve
the puzzle. The next picture shows the whole situation. Let us continue our detective work.
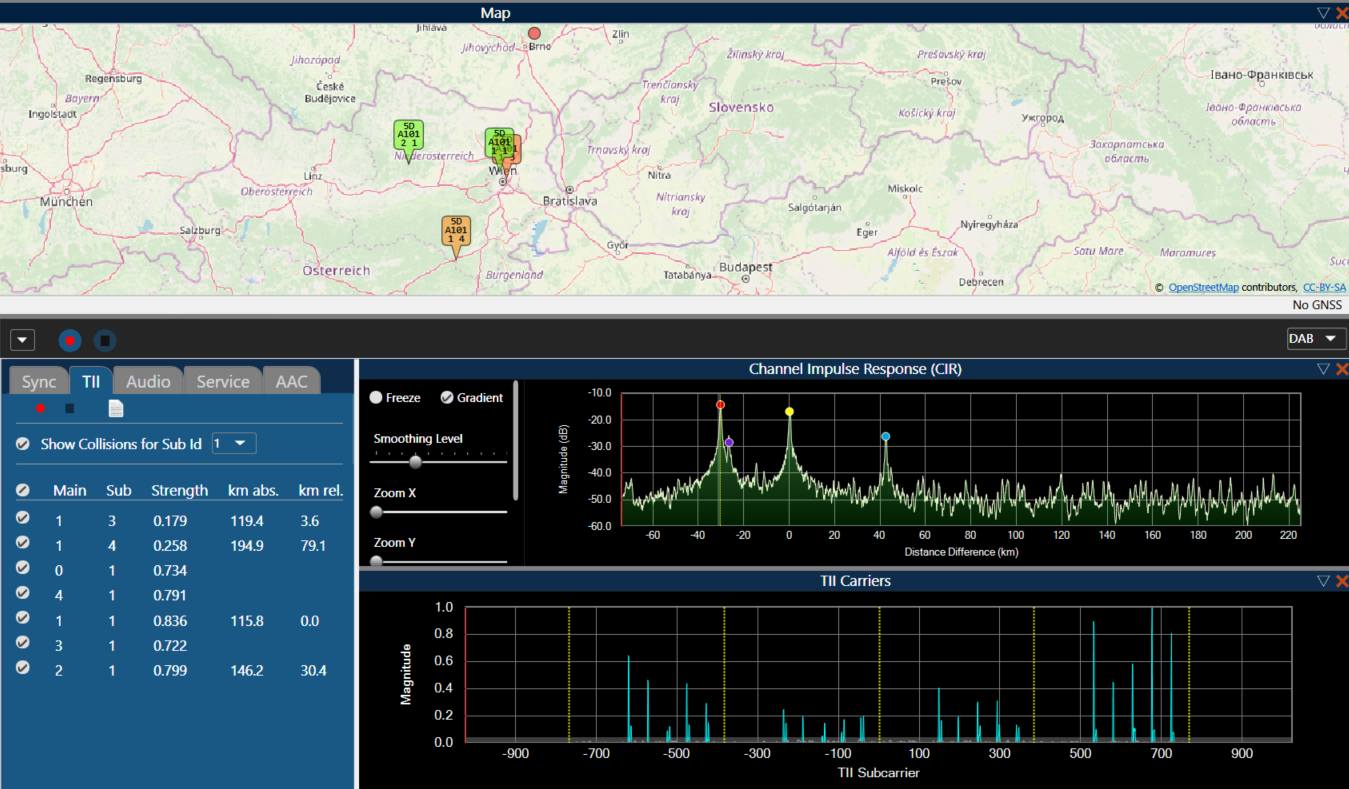
-
Four Transmitters from the Database
The map shows four transmitters, extracted from TII List values in the database. The fourth (Main/Sub of 1/3) is a "normal" one not contributing to the collision. It showed up after the TII threshold had been reduced. The threshold must remain well above the noise though, see the TII Carriers diagram. -
Four Peaks in the CIR
The CIR diagram shows four peaks, not more. As every "real" transmitter must produce a peak, we assume a situation without multipath. The height of the peaks might be compared to the one of the TII Carriers spectrum, although the former is logarithmic, the latter linear. -
"Strength" in the TII list and the CIR
Ordering the four assumed transmitters according to their strength in the TII list, we get the following ranking:
1/1
2/1
1/4
1/3
Please keep in mind that this is a measure averaged over all 16 carriers of a transmitter, so read these values with caution.
Assuming this ranking being reflected by the magnitude of the peaks in the CIR, would result in the following assignments:
CIR red dot peak ->1/1
CIR yellow dot peak ->2/1
CIR blue dot peak ->1/4
CIR violet dot peak ->1/3 -
Geographical Distance Differences
The following table shows the distance differences between the receiver position and each of the four transmitters retrieved from the database, easily calculated from the TII list, in kilometers:
1/1 - 2/1: 30.4km
1/1 - 1/3: 3.6km
1/1 - 1/4: 79.1
2/1 - 1/3: 30.4 - 3.6 = 26.8km
2/1 - 1/4: 30.4 - 79.1 = 48.7km (abs. value)
1/4 - 1/3: 79.1 - 3.6 = 75.5km
Of course these values are correct only if the position of the receiver - red dot in the map - is accurately known. We can safely assume this, as the recording was made with an active GPS sensor. -
CIR Distance Differences
The following table shows the distance differences between each of the four peaks in the CIR diagram. The Main/Sub Id assignment is taken from the above comparison.
1/1 - 2/1: Red - Yellow: 30km
1/1 - 1/3: Red - Violet: 3.8km
1/1 - 1/4: Red - Blue: 72.6km
2/1 - 1/3: Yellow - Violet = 26.2km
2/1 - 1/4: Yellow - Blue = 42.7km
1/4 - 1/3: Blue - Violet = 68.9km
The CIR distance differences must be read with considerable caution. The - unknown - artificial delay of the transmitted signal, often applied for reasons of network optimization, could render this information almost useless, depending on the size of the inferred delay. Nevertheless it is a valuable tool to estimate the location of detected transmitters.
Conclusion
- The two transmitters 1/1 and 2/1 area already present in the database. Thus, they are verified to exist, which of course not yet guarantees the reception in the actual situation. This uncertainty is a main reason for the cross-checks with the CIR.
- The CIR shows the same number of peaks as there are number of assumed transmitters. If more transmitters would contribute to the collision then they must show up with a peak in the CIR. This does not happen.
- The strengths ranking of the received signals in the TII list fits to those of the assumed transmitters in the CIR diagram.
- The geographical distance differences between the receiving location and the assumed transmitters fits well to those read from the CIR diagram. This is the strongest of our cross-checks.
These findings present strong arguments leading us to the final conclusion that the colliding transmitters are the ones with TII Codes 1/1 and 2/1.
We exclude the theoretical possible transmitters with TII Codes 0/1, 3/1 and 4/1. These conclusions are based on our above investigations.
Our goal was to resolve the TII Collision.
Puzzle solved. Mission accomplished.
Summary
-
Here I present a compact list of the steps which are needed to resolve a TII Collision with the currently available possibilities in QIRX.
- Identify grey peaks in the TII Carriers. Get their Sub Ids by hovering over them with the mouse. Zoom for easy reading.
- Check whether at least five carriers are present in a "compartment" sharing the same Sub Id.
- Select that Sub Id in the "Sub Id" combo box of the TII list. Activate the checkbox "Show Collisions...".
- From the presented list, prioritize the ones being presented on the map, i.e. corresponding to already verfied transmitters.
- Check the number of CIR peaks with the assumed number of transmitters, including the assumed offending ones.
- Compare the distance differences between the receiver geolocation and the assumed transmitter geolocations to the ones obtained from the CIR. Make sure you entered the correct own receiver position in the map.
- Compare the signal strengths as read from the TII list with the peak magnitudes from the CIR diagram.
- Conclude and decide.
Credit
Thanks a lot to Petr, OK2HF, who provided the raw data for this investigation.