QIRX V3: Frequencies
This page deals with frequencies.- Tuning: Selection of a certain frequency
- Zooming: Reducing the frequency range of the spectrum plot, mainly for viewing more details
- Resolution: Determining the frequency resolution in a certain scenario
- Spectrum Resolution Calculation
- FFT Window
- Demodulators: The frequency resolution applied in the demodulators
Tuning
-
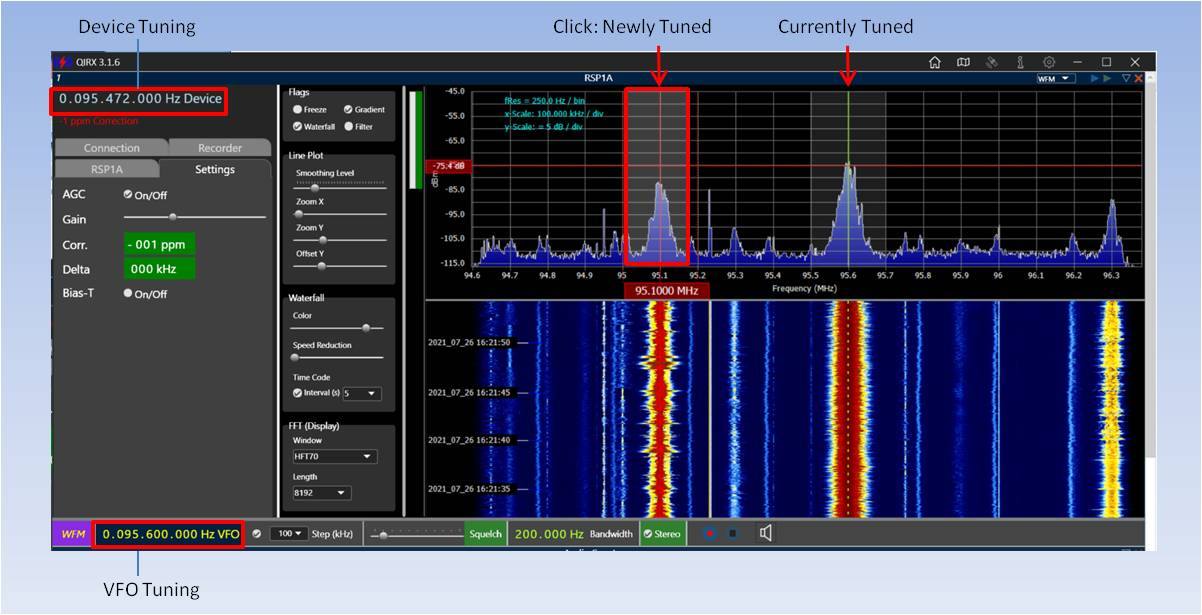
VFO Tuning: VFO is a commonly used shortcut for "Variable Frequency Oscillator". Here it simply means that your SDR can be tuned to any
frequency you like, within its possible range, by adjusting the digits withthe mouse. This is the usual and recommended way of selecting a frequency. It
works very fast and accurately, because all digits can be operated by using the mouse wheel.
The Device Frequency indicator on the top and the spectrum plot are updated automatically, if necessary.
The Step(kHz) indicated number does NOT affect this kind of tuning, even if checked.
Hint: A right click into a digit zeroes all digits to the right of it. This is often desirable and works on all mouse-editable fields, not only the VFO indicator. -
Device Tuning: This operates directly on the device, i.e. the device frequency is changed. The device frequency is
in the center of the frquency plot, in case no x-zoom is applied. The VFO frequency and the spectrum plot are updated.
This frequency selection method is NOT recommended. It is mainly provided to have an indication of the frequency which
the device is currently tuned to.
No rule without exception: When - for whatever reason - in ADS-B mode the wrong frequency is indicated, then the Device Tuning is the only way to get the necessary 1090MHz tuned. -
Click into spectrum: A click into the spectrum plot tunes to the selected frequency.
The "Step(kHz)" indication - when selected - dictates the
steps of the mouse movement in the spectrum. In this way it is possible to exactly hit narrow-band frequencies.
As an additional indication the selected RF bandwidth is drawn as two dashed vertical lines
on the right and left of the selected
frequency line.
This selection method is also possible in the waterfall spectrum.
Zooming
The frequency axis can be zoomed by shifting the slider "Zoom X". It influences the way the frequencies are displayed in the spectrum.
-
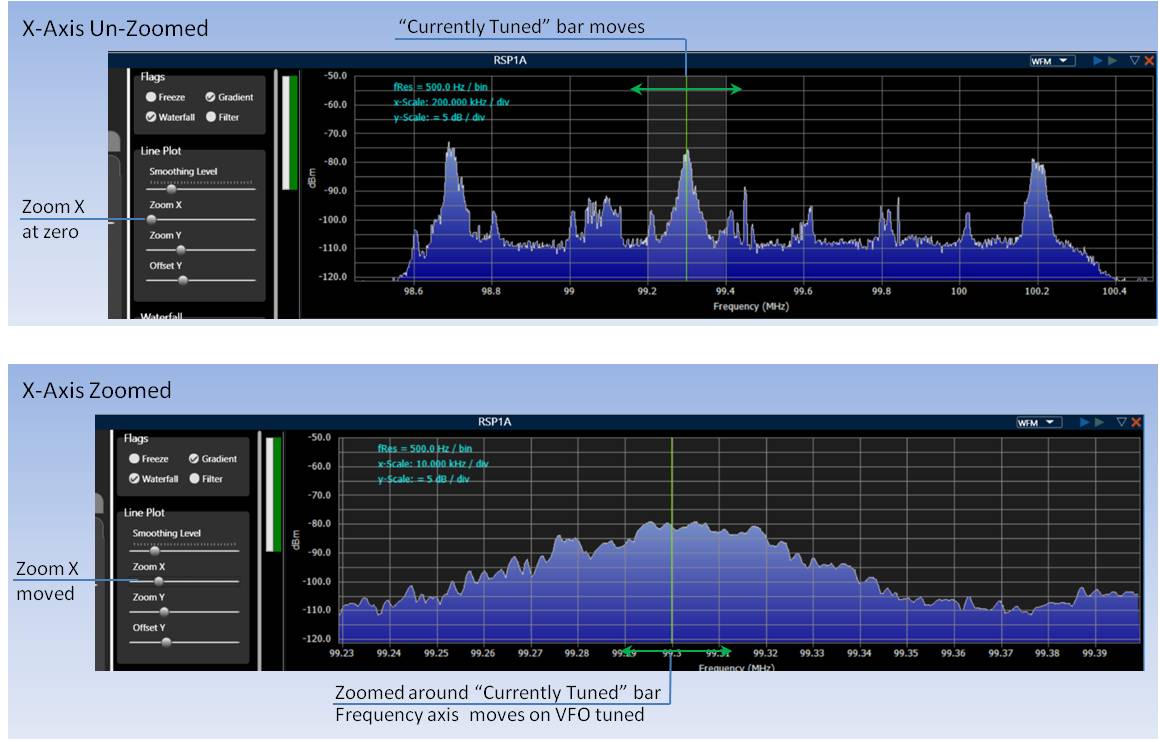
Un-Zoomed: The "Zoom X" slider is positioned completely left. The spectrum displays the full range according to the selected
sampling rate. For instance, with the RSP1A and a sampling rate of 2.048Msps a range of 2.048MHz is displayed.
The spectrum is attenuated at the borders, because the RSP1A offers a bandwidth of 1.536MHz.
When the VFO is tuned, the green selection bar moves until it approaches the border, then it stays and the spectrum together with its scale moves. -
Zoomed: The "Zoom X" slider is moved. The spectrum is zoomed around the green selection bar.
When tuning the VFO, the green selection bar stays in place, and the spectrum together with its scale moves.
Zooming only very slightly is a convenient way to select that not the selction bar should move, but the spectrum and its scale.
Resolution
Different scenarios require different frequency resolutions in the spectrum plot. Examples:
- AM Sidebands: Inspections of the AM sideband bandwidth can give a hint about the necessary bandwidth for a certain station.
- SSB Tuning: Visualization of the SSB waterfall spectrum gives an indication where to position the suppressed carrier for a proper reception.
-
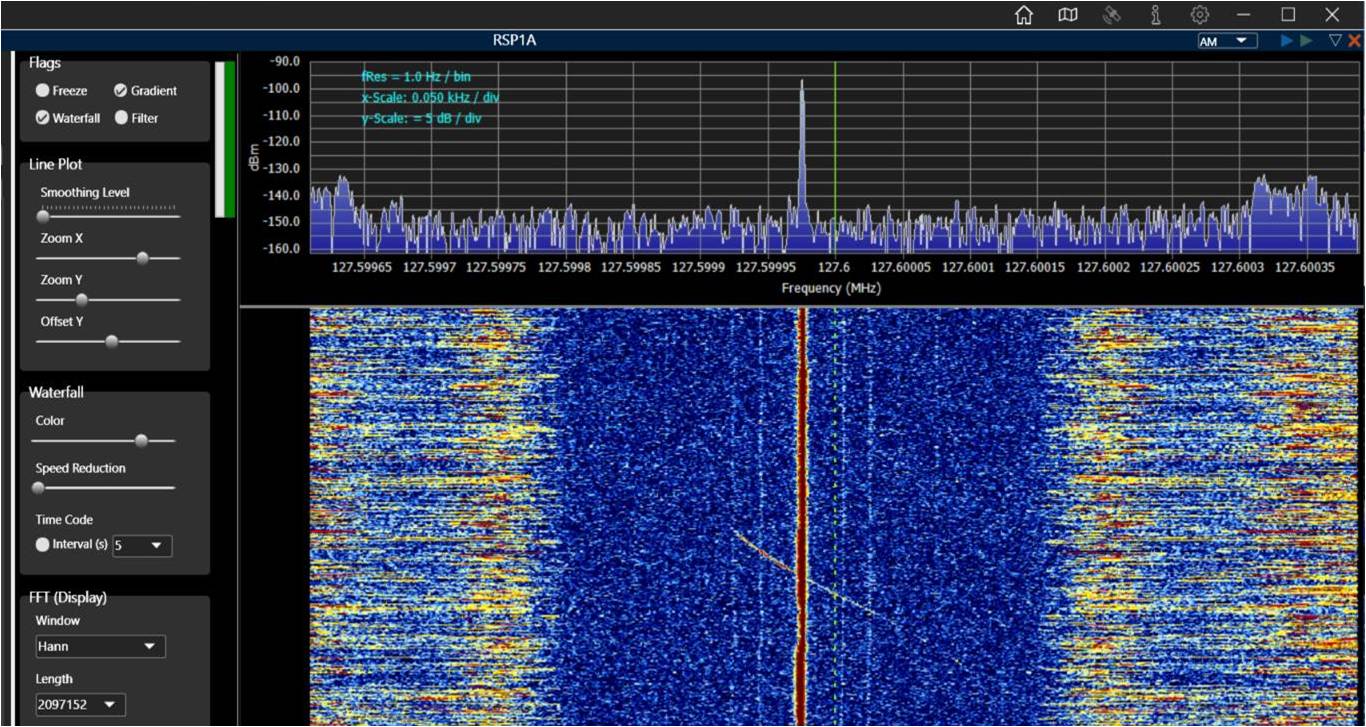
Aircraft Doppler Shifts: When e.g. a strong VOLMET airband broadcast transmitter is in range,
the gap between the central carrier and the start of the sidebands can show the Doppler-shifted carrier
of aircraft flying by.
This requires a high resolution spectrum, because the shift is small.
The screenshot shows such a Doppler echo (i.e. the crossing line) with a high frequency resolution. Each vertical division has a width of 50Hz, the FFT length was more than 2 Million points, each frequency bin got a width of 1Hz.
Spectrum Resolution Calculation
For the calculation of a suitable frequency resolution, two parameters have to be considered, the sampling rate and the FFT length.
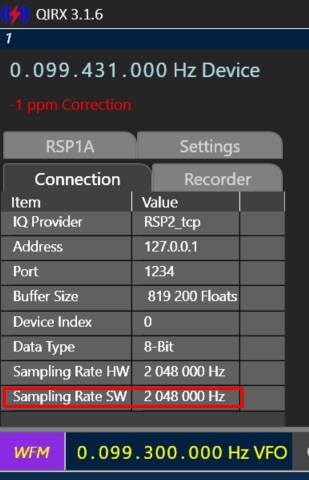
- Sampling Rate: For the spectrum plot, the "Software Sampling Rate" is necessary. Sometimes the hardware offers sampling rates not very suitable for software applications. For instance, DAB demodulations needs I/Q data having been sampled with 2.048Msps, which not every hardware is able to deliver. The Airspy can send data sampled with 4.096Msps, which have to be "decimated" by a factor of two before processing. "Decimation" means filtering and downsampling. You find the two sampling rates in use on the "Connection" tab of the Frontend section on the GUI. If you are in doubt whether a certain sampling rate can be used in your scenario, please counsult the Setup Dialog on this website.
-
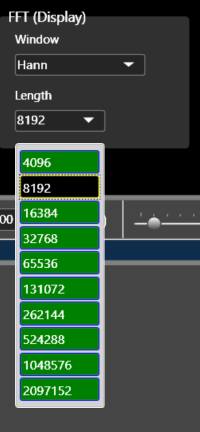
FFT Length: "FFT" means "Fast Fourier Transform" and indicates the algorithm used to transform
the I/Q data from the time domain to the frequency domain. The frquency spectrum shows the result of the FFT.
"FFT Length" indicates the number of I/Q data used to perform the FFT. This number determines - together with the Sampling Rate - the frequency width of a single point of the FFT outcome (usually called a "bin"). The simple formula is:
Frequency Resolution fRes = Sampling Rate / FFT Length.
In our high-res example with the Doppler Shifts we get 2,048,000[1/sec]/2,097,152[bin] = 0.977/sec/bin ~ 1Hz/bin.
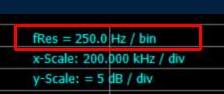
For convenience, this calculation is also performed in the software and the result is indicated as an inset into the spectrum plot. - FFT Length Selection: The FFT length can be selected from the corresponding dropdown box.
There is no such thing as a free lunch. Usually, one does not want to set the frequency display to an extremely high resolution like the one
above in the Doppler shift example. The reason is simple: The higher the FFT length, the longer it takes to collect the I/Q data
to fill the memory buffer for the FFT. In our above example
it already takes one second to fill the FFT buffer once. This results in some disadvantages:
- Slow Display: The spectrum display is slowed down. Of course, this holds also for the waterfall display.
-
No Realtime: As a result, one loses the responsiveness of the spectrum. The longer the FFT length, the worse
is the realtime behaviour of the display.
The tradeoff between high timely resolution (responsiveness) and high frequency resolution (high FFT length) is a well-known fundamental property of every Fourier Transform.
FFT Window
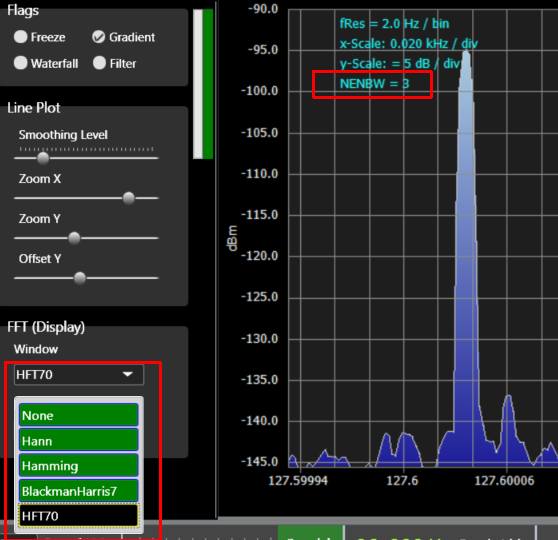
For its spectrum display, QIRX offers the selection of different "FFT Windows". One of their uses is to allow a single peak in the display to be confined in a narrow region, and not do decay slowly in case that peak does not hit the exact center of a FFT bin. I will not go into further details here, in case you have more interest in the topic you might consult National Instrument's Application Note 041 "The Fundamentals of FFT-Based Signal Analysis and Measurement", describing the topic to some detail.Here, we are interested in the practical use of these "FFT Windows". They come into play if you are keen on separating two neighboring peaks in a high-resolution spectrum, like the one in the picture with the un-collapsed drop-down box. All of these windwos, except the "None" have the (adverse) effect that they widen the peak, meaning that a narrow single peak will occupy more than one frequency bin in the spectrum.
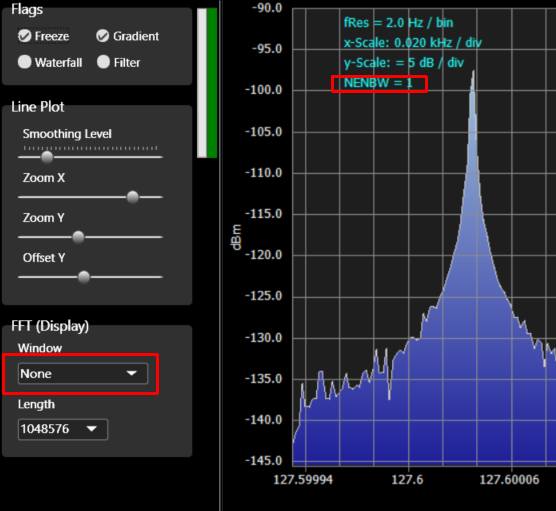
Then, why not stick with the "None" altogether? Because another property comes into play, the "sidelobes". These (also unwanted) properties mean that a peak widens on decaying into its neighboring bins. And the "None" widens very much.
But how many bins are occupied by using a FFT Window? The answer is given in the inset of the spectrum. It is the NENBW property, indicating the number of FFT bins a single peak will occupy in the spectrum. "NENBW" means "Normalized Equivalent Noise Bandwidth".
Here is a short list of the recommended use for the offered FFT Windows:
- None: Used for: Nothing, just for comparison how much sidelobes it produces.
- Hann: Excellent allround FFT Window. NENBW is 1.5, rounded to two in the inset. Good choice for e.g. Doppler effect measurements, mentioned above. Not recommended for accurate level measurements.
- Hamming: Like Hann, a very good "Allrounder", often used in other applications as well. NENBW is 1.3, rounded to 1. Best separation between two neighboring peaks, due to its low NENBW. Not to be used for accurate level measurements.
- BlackmanHarris7: Lowest sidelobes of all offered FFT Windows, meaning low-level peaks not too near by can be resolved.
- HFT70: "Flat Top" Window with low sidelobes. Due to its "flat top" it is used for accurate level measurements, e.g. using the calibrated scales for the RSPs or the RTL-SDRs with a R820T tuner.
Remark: Very detailed properties of the mentioned FFT Windows, together with a robust theoretical explanation, but
written for the practitioner, are presented in the widely cited paper by
Heinzel et al (2002), "Spectrum and spectral density estimation by the Discrete Fourier
transform (DFT), including a comprehensive list of window functions and some new flat-top windows".
Demodulators
The flexibility outlined in the above description applies for the spectrum display on the GUI. As QIRX works FFT-based for its demodulators,
similar considerations have to be made for them. However, usually there is no need to be able to adjust e.g. the FFT length in a wide range.
As a result, the FFT lengths applied in the demodulators are fixed values.
For the demodulator FFTs, the "Hann" window is used.
For the demodulator FFTs, the "Hann" window is used.
- "Standard" Demodulators: AM, NFM, WFM: The FFT length used is 65535, with a sampling rate of 2,048,000sps a frequency resolution of about 32Hz is achieved. This is sufficient for SSB tuning, and corresponds to the frequency resolution of RTL-SDR dongles.
- DAB: The FFT length used is 2.048, resulting in a frequency resolution of 1kHz (sampling rate of 2.048Msps), adapted to DAB's OFDM specification with a carrier separation of 1kHz. In case of the selection of a higher sampling rate by the user, the samples are down-converted to a rate of 2,048,000sps before processing further.
- ADS-B: The decoder is not affected by this consideration, as it works directly on the I/Q data, sampled in QIRX at 2Msps.