QIRX V3: RF Spectrum Levels
There are two types of RF spectrum level designations: Un-calibrated and calibrated
-
Un-calibrated: This type of vertical spectrum scale indicates relative values in decibels (dB). It is a relative scale without
any particular reference level. However, it is linear in its behaviour. This means that e.g. xdB more/less of decibels arriving at the
receiver antenna input, the scale indicates xdB more/less.
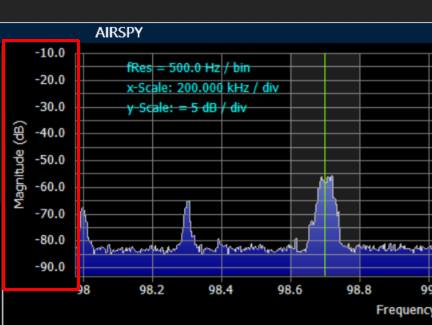
Receivers showing this type of RF level are the ones which are hard to calibrate in the QIRX environment.- Airspy: The airspy_tcp.exe driver does not yet have a back-channel from the driver back to QIRX, reporting the applied gain. Thus, no properly calibrated values can be shown for the devices.
- RTL-SDR Dongles with a FC2580 tuner.
-
Calibratable, not measured yet: RTL-SDR devices with tuners which can be calibrated, but have not
been systematically measured yet with QIRX. These are devices with the following tuners:
- E4000
- FC0012, FC0013
- R828D. In QIRX, it appears as calibrated, but there are larger deviations between 250 and 400MHz to expect.
-
Calibrated: Calibrated device types are the ones where distinct levels of some devices have been
measured across a wide frequency range with an accurate industrial signal generator.
The expected accuracies are between 3dB @100MHz to 6dB @1.6GHz, for RTL-SDR-based
receivers. Possible reasons are for instance sample variations or hardware layout differences between manufacturers.
The expected accuracy for the RSPs is in the same range, down to 1MHz.
Please keep in mind that only very few samples have been measured. Individual calibrations should be possible though.-
RTL-SDR with R820T(2) Tuners: These devices have been thoroughly investigated by
Bernhard, DB9PP, and Oldenburger,
who thankfully provides his rtl_tcp.exe on GitHub. His rtl_tcp software (distributed in the QIRX package) reports accurate
overall gain levels to the QIRX software, serving as the foundation for the calibrated values.
Both also provided the algorithm for the indication of these values on the screen. Another unique feature of Oldenburger's rtl_tcp is that it does not drop samples when running under Windows, in contrast to the standard rtl_tcp. -
RSPs from sdrplay: I measured the RSP1A, RSP2, RSPduo (Single Tuner mode). All of them showed
a very nice and linear behavior across their whole frequency range from 1MHz up to 2GHz. Below 1MHz the accuracy
deteriorated. The diagram shows the measured values for the RSP1A. No frequency-specific correction was applied.
Probably the accuracy could be considerably enhanced by calibrating an individual device, together with a correction at specific frequencies.
For the measurement, at each frequency three levels of -15dBuV, 20dBuV and 90dBuV were applied. The dots indicate the level values in the QIRX spectrum.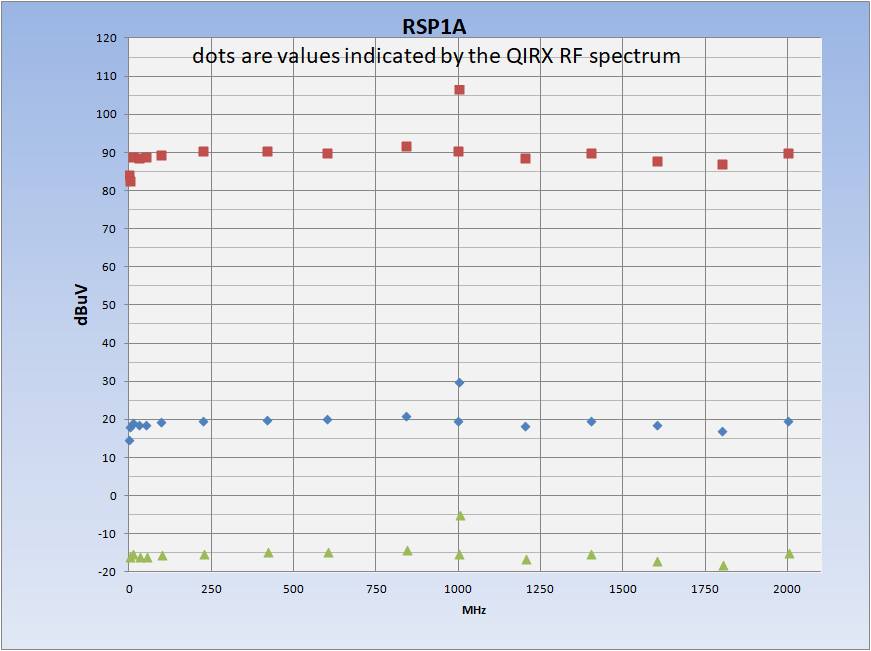
The rather large error at 1GHz occurs when changing from 999MHz to 1GHz. Changing in the other direction, i.e. "coming from above", this behavior was absent. The reason is not clear.
-
RTL-SDR with R820T(2) Tuners: These devices have been thoroughly investigated by
Bernhard, DB9PP, and Oldenburger,
who thankfully provides his rtl_tcp.exe on GitHub. His rtl_tcp software (distributed in the QIRX package) reports accurate
overall gain levels to the QIRX software, serving as the foundation for the calibrated values.
Calibration Comparison R820T - RSP1A - Signal Generator: The picture shows a comparison of the VOLMET broadcaster at 127.6MHz, between
a RTL-SDR dongle (one of the four in the Kerberos hardware) and a RSP1A, recorded with exactly the same
values like antenna, cable, Zoom values etc.
The difference is very small given the fact that both tuners have different design. For these displays the "Flat Top Window" HFT70 has been chosen for the FFT. According to the documentation, it induces an error of not more than 0.0066dB, being neglectable in the measurements.
It might be noted that the peak level is independent of the selected FFT Length, as the "Power Spectrum (PS)" display had been selected, maintaining the peak values and changing the noise floor when changing the FFT length. This is in contrast to the - also selectable - Power Spectrum Density (PSD) display.
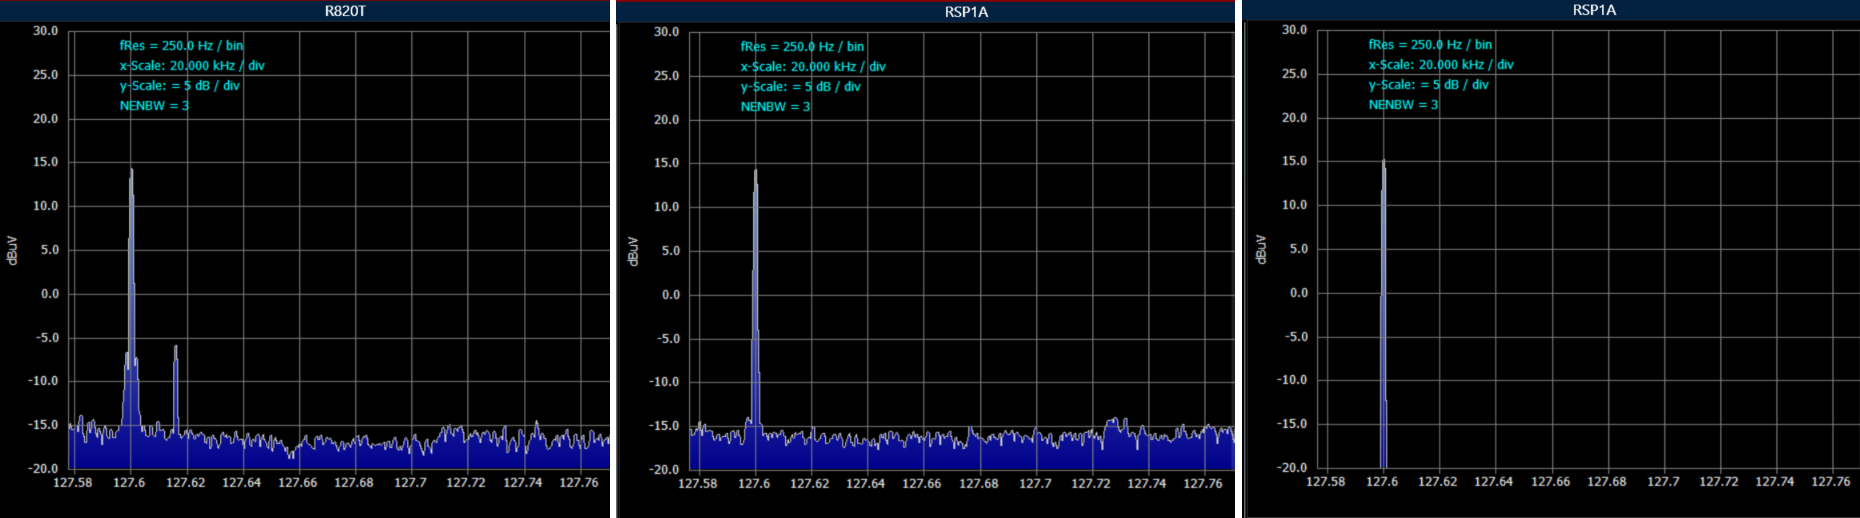
The second peak in the RTL-SDR spectrum is an artifact.
The difference is very small given the fact that both tuners have different design. For these displays the "Flat Top Window" HFT70 has been chosen for the FFT. According to the documentation, it induces an error of not more than 0.0066dB, being neglectable in the measurements.
The rightmost picture shows the peak from the Signal Generator,
having been tuned to 127.6MHz with an output level of 15dB µV. As is expected, the noise level is much smaller in this case
than from "live" antenna signals.
It might be noted that the peak level is independent of the selected FFT Length, as the "Power Spectrum (PS)" display had been selected, maintaining the peak values and changing the noise floor when changing the FFT length. This is in contrast to the - also selectable - Power Spectrum Density (PSD) display.
The second peak in the RTL-SDR spectrum is an artifact.
Remark: In the spectrum display, a selection between a simple curve
and a curve with a "Gradient" underneath is selectable in the "Flags" section of the Frontend GUI.
For the best accuracy, please select "Gradient". The reason is that for the non-Gradient curve a spline interpolation is used. Due to the algorithm, it may cause slightly incorrect peak heights at some screen widths, although the curve looks nicer.
The curve with the underneath gradient does not use such an algorithm, it just connects the points by straight lines, avoiding such errors.